
Know what happened, and why
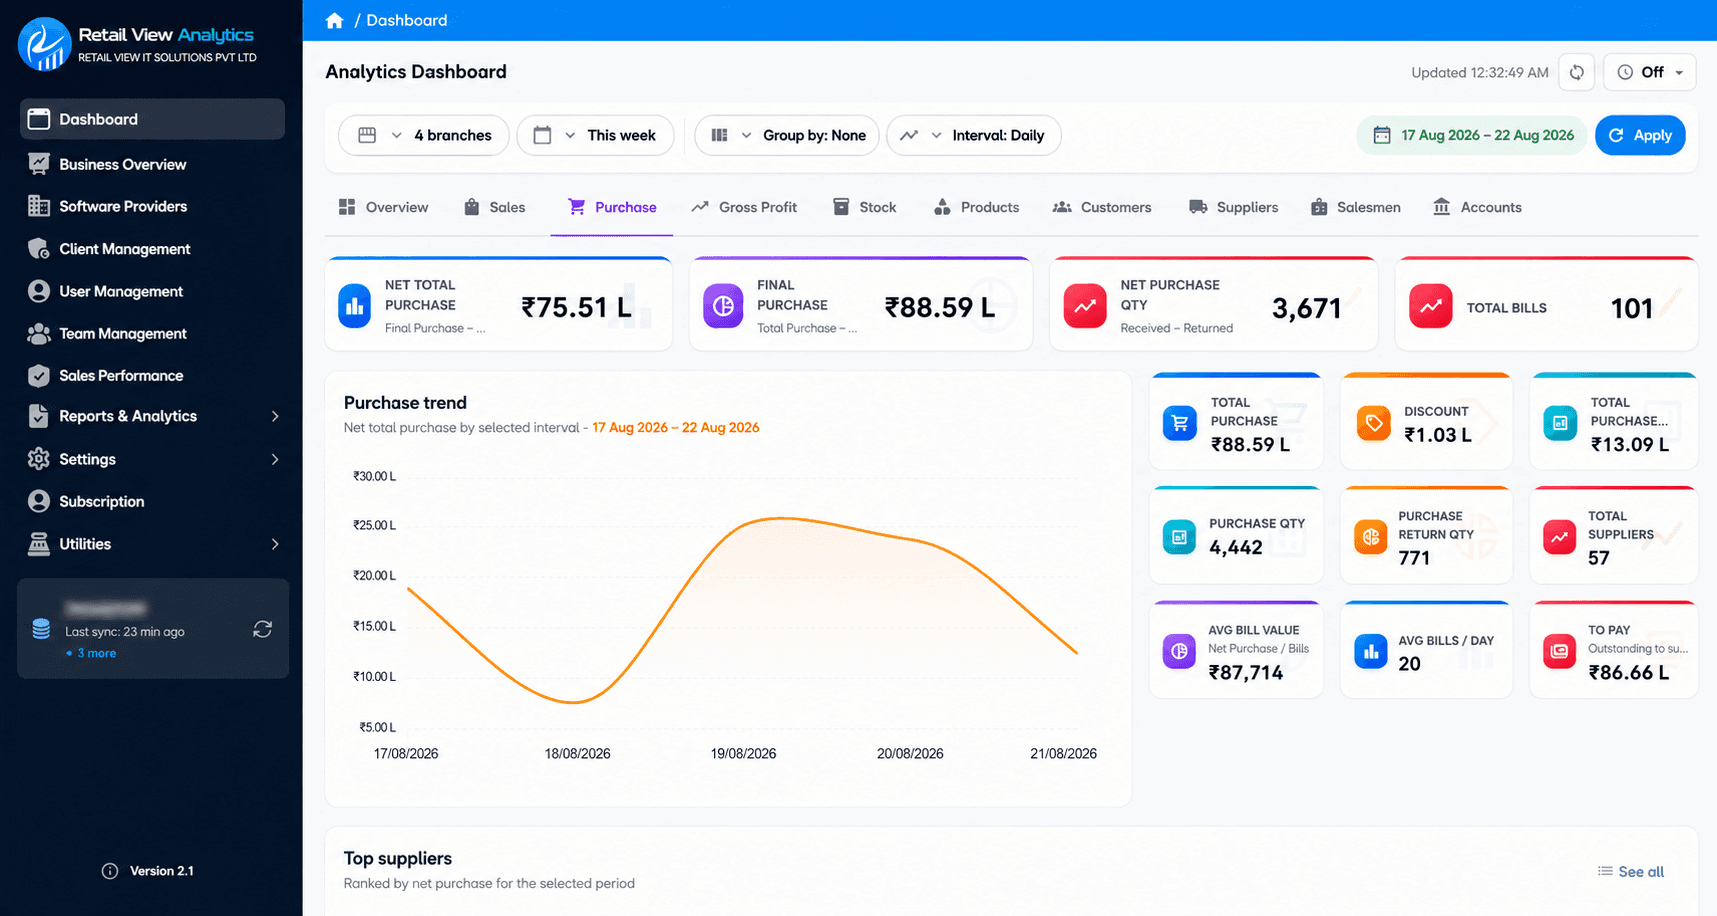
Live dashboards, sales performance by person and store, commission and target tracking, and a report builder that answers the question you actually asked.
- Multi-outlet consolidation
- Build your own reports
- Commission automation
- Scheduled exports
Live
Dashboards updated from trading data
Every outlet
Consolidated in one view
Self-serve
Build reports without developers
Reconciled
Figures that agree across modules
Reporting that people trust enough to act on
Most retail reporting fails in one of two ways: the numbers do not agree with each other, or getting the number you need means asking someone to write a query. Retail View Analytics is built against both.
Every figure traces back to the transactions that produced it, across POS, procurement, accounts and CRM. And when a standard report does not answer the question, the report builder lets your team assemble one and save it, without involving us.
It runs on top of Retail View POS, or against your existing trading data.
Capabilities
What Retail View Analytics does
Each area below has its own detail page - open any card to see how it works.
Numbers that agree with each other
The fastest way to lose confidence in a reporting system is for two reports to disagree. Retail View Analytics reads from the same transaction records that produced the invoice, the stock movement and the ledger entry - so the sales dashboard, the GST summary and the general ledger are three views of one truth, not three separate calculations that happen to be near each other.
- Single transactional source across POS, accounts and procurement
- Drill from any summary figure to its underlying transactions
- GST summary reconciles with the sales register
- No overnight aggregation that can silently drift
Your team builds its own reports
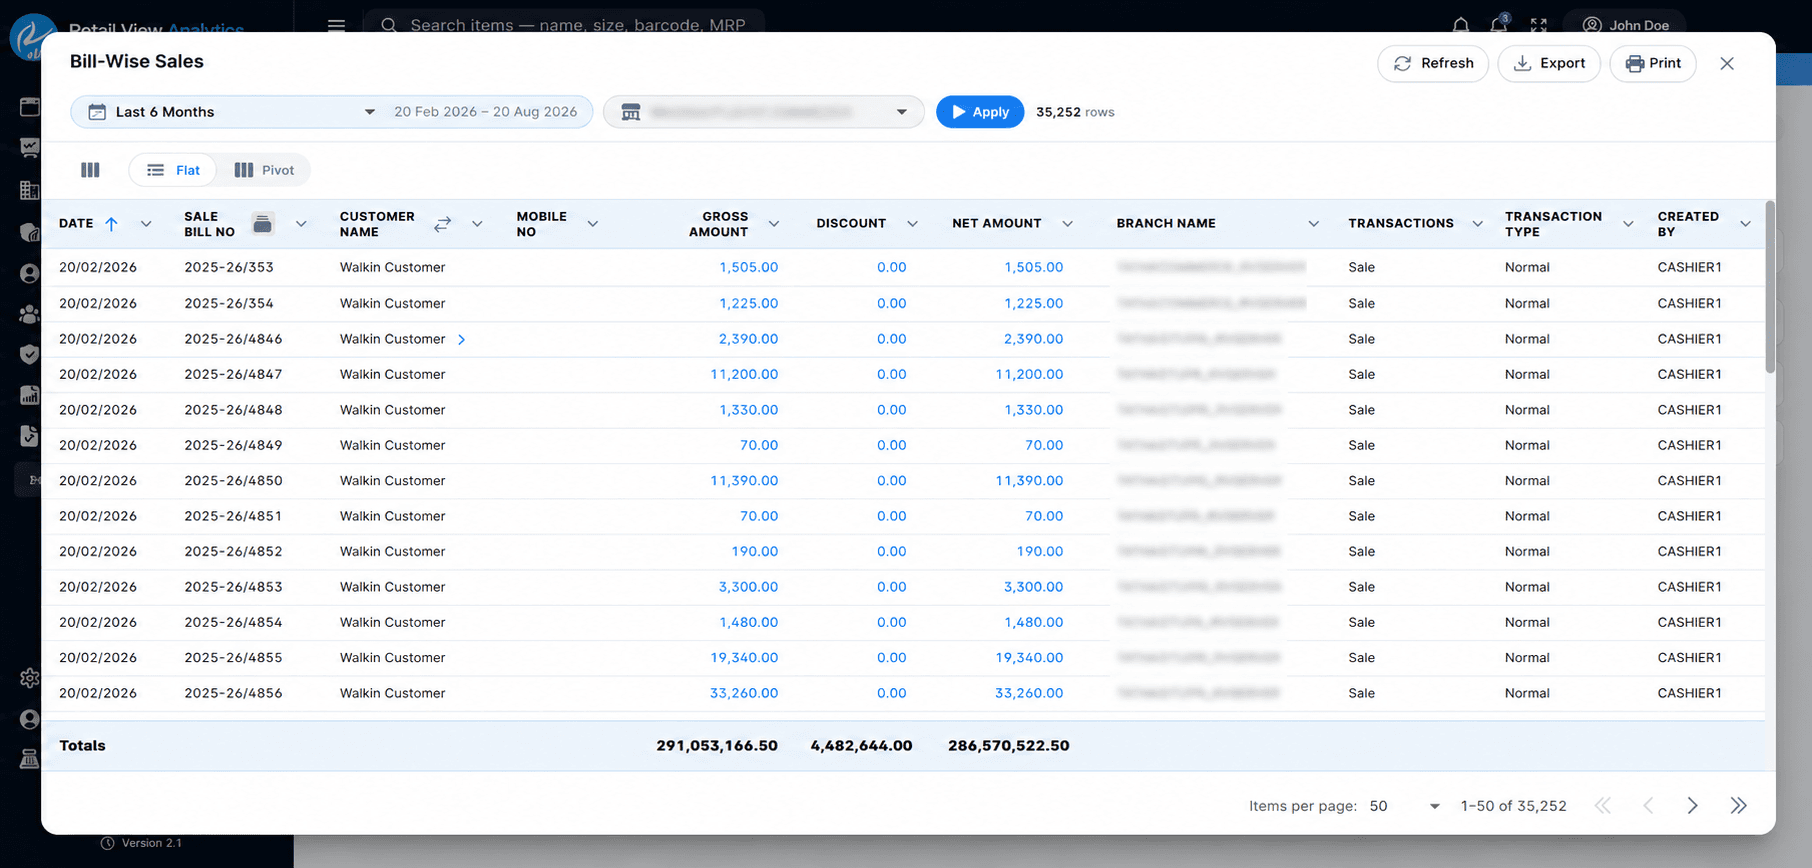
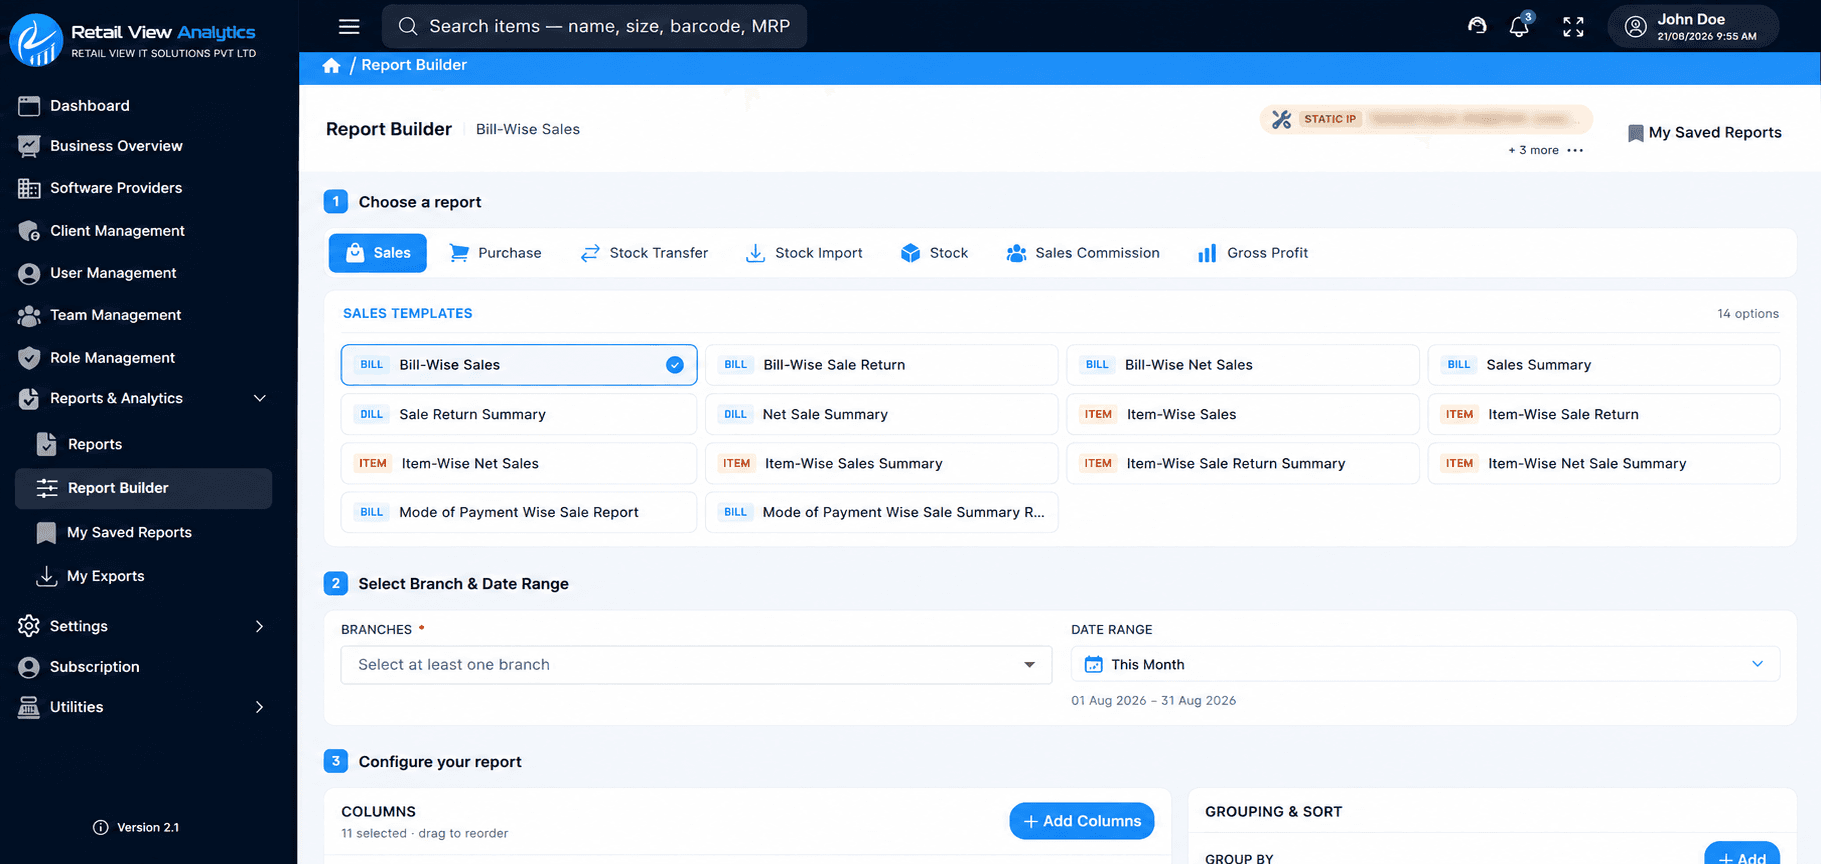
Every retail business eventually needs a report nobody anticipated. When that means raising a request and waiting, the decision gets made without the data. The report builder puts field selection, filtering and grouping in your team's hands, with the result saved and shared - so the next person asking the same question gets an answer immediately.
- Visual field, filter and grouping selection
- Save and share reports across the team
- Export history retained in My Exports
- No developer time, no change request
Performance and pay, from the same numbers
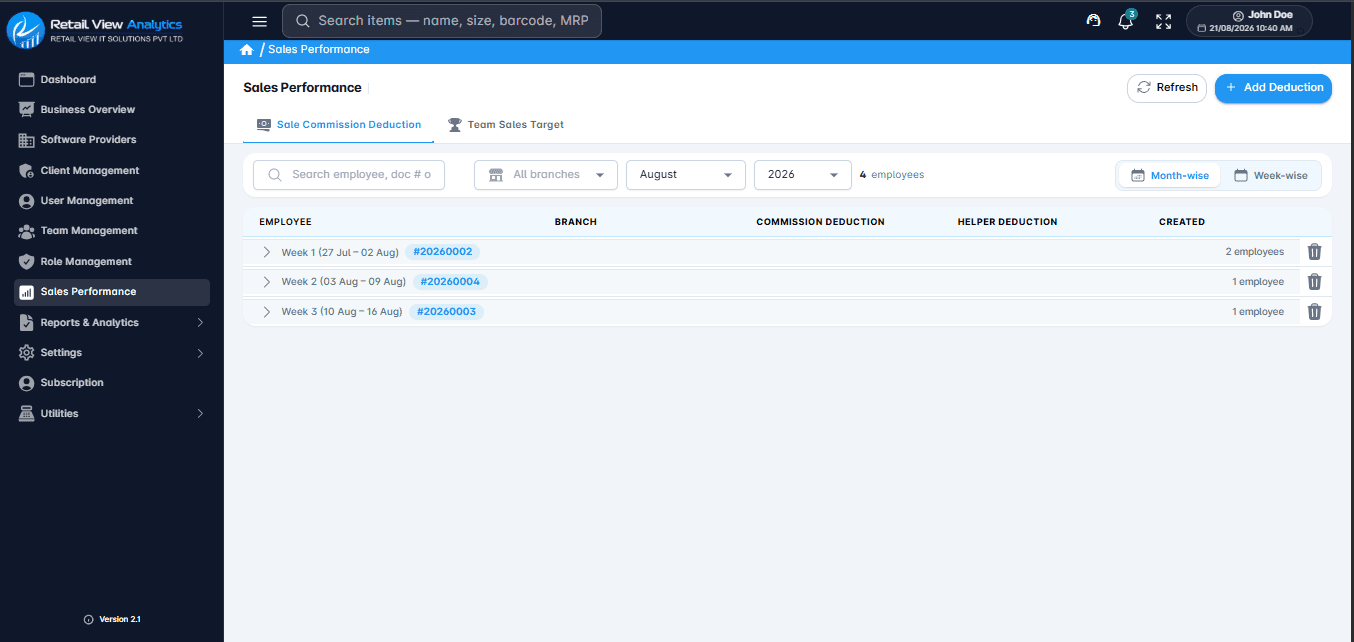
Sales performance, team targets and commission all run off recorded sales rather than a separately maintained spreadsheet. That means the leaderboard, the target attainment and the commission statement cannot disagree - and an incentive conversation starts from a figure both sides already accept.
- Employee performance measured against assigned targets
- Slab-based commission calculated automatically
- Team roll-up for targets and attainment
- Commission statements ready for payroll
Who it is for
Businesses running Retail View Analytics
Owners & directors
The whole group on one screen, with the outliers surfaced rather than buried.
Store & area managers
Performance against target for their people and their locations.
Finance teams
Ledgers, GST summaries and exports that reconcile with trading data.
Sales leadership
Targets, attainment and commission, all from the same source.
Where it runs
- Web application, any modern browser
- Responsive on tablet
- Excel export throughout
- Runs on Retail View POS data or your existing trading data
Common questions
See Retail View Analytics on your own numbers
Tell us how you operate today and we will walk you through exactly what changes.